Data Visualization
Data visualization projects always start with considering both the data and the user. Many of the projects below were designed to be used with one's own data, and to be part of a researcher's workflow. For this reason, the visuals are often relatively simple, but still designed to offer insight into the data and mathematical concepts. To incorporate these visualizations into your own workflow, please see my github for the code.

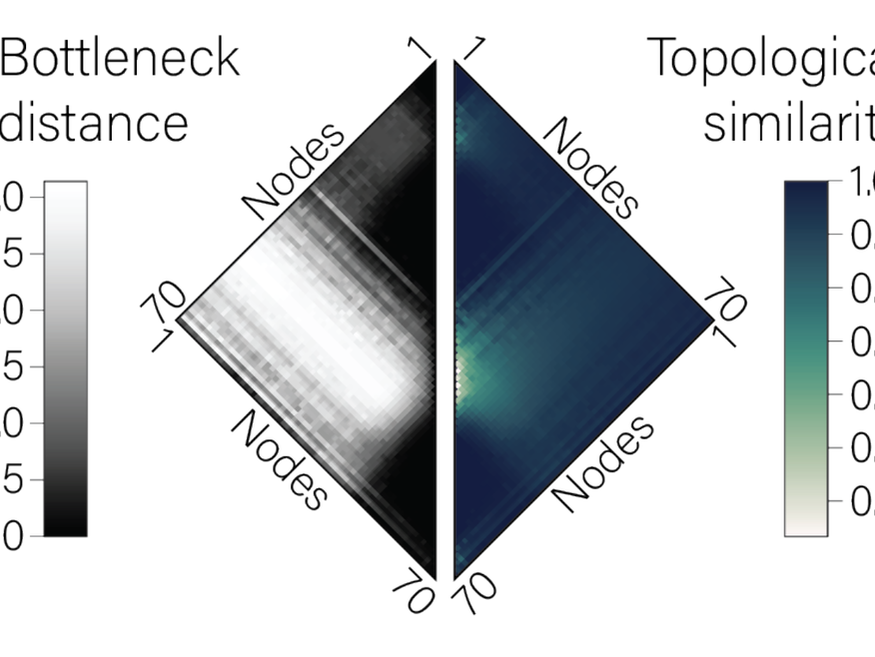
Simplicial complex visualization2020
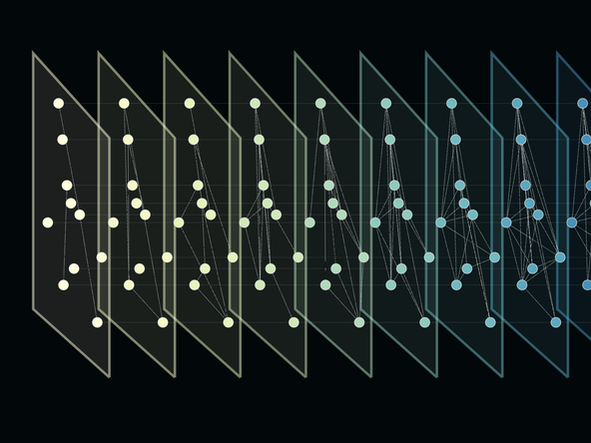
Temporal Networks2020
|
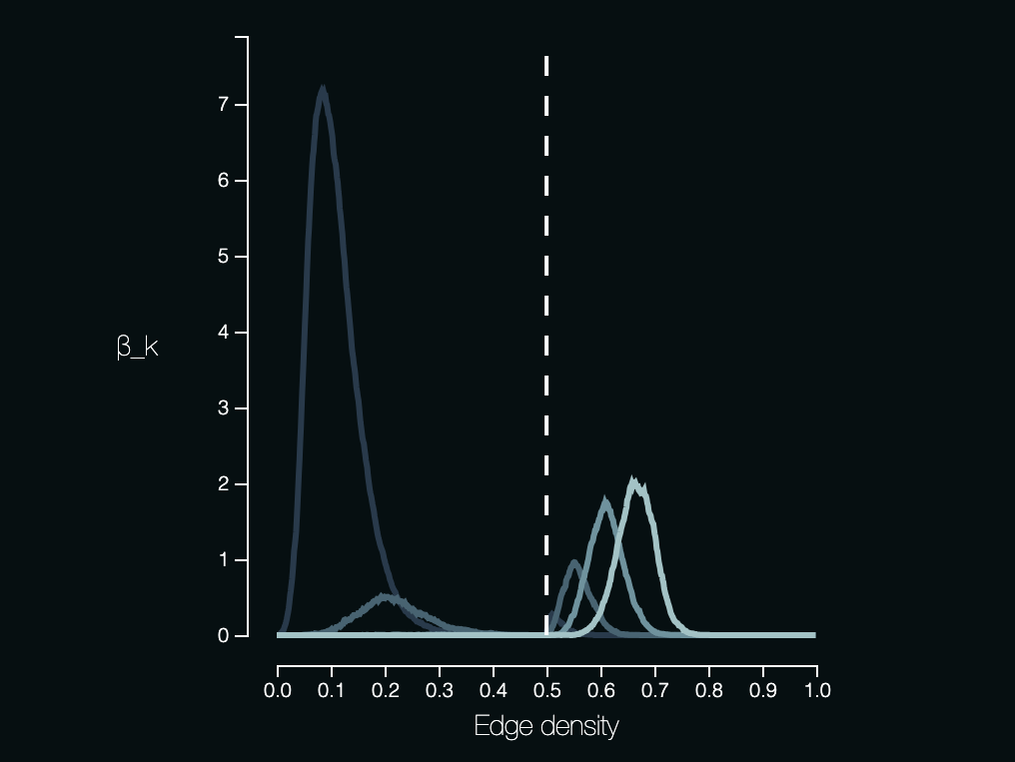
Noisy Networks2021, Paper supplement
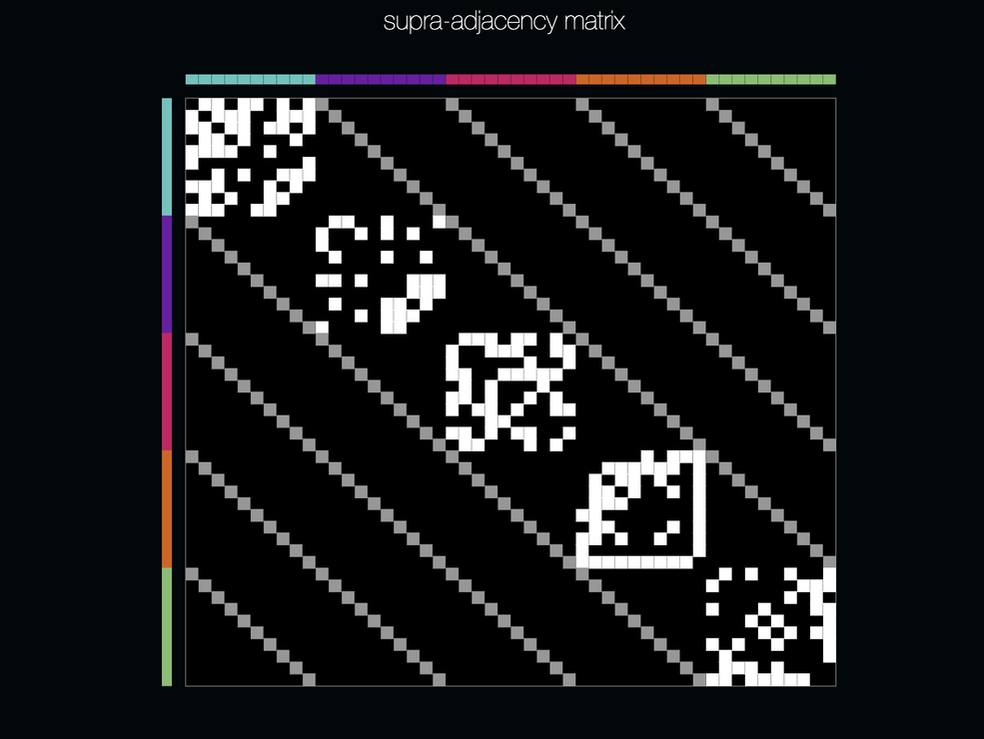
Multilayer Networks2020
|
Reordering Networks2019, Paper
|
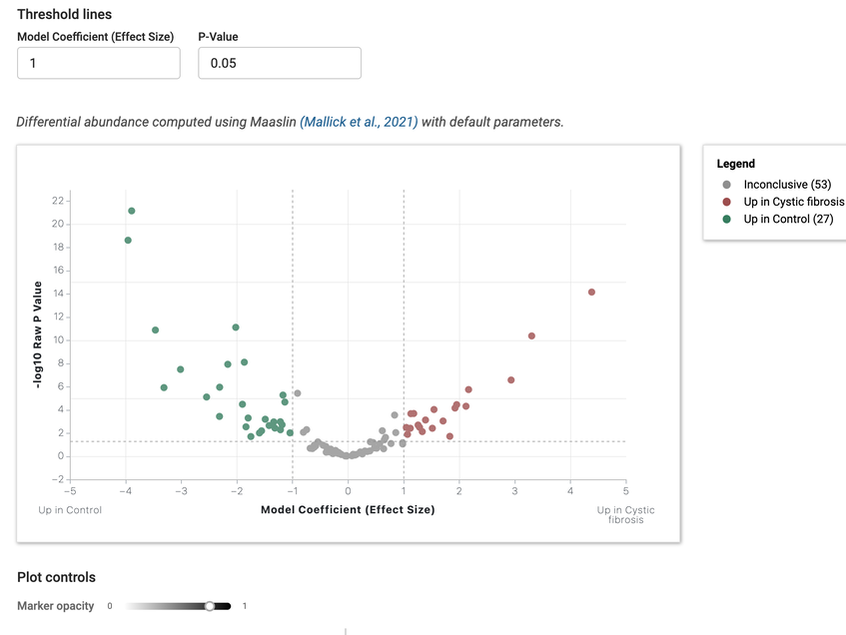
Volcano Plot Web App2023, MicrobiomeDB.org
|