ANN SIZEMORE BLEVINS
  • home
  • research
  • code
  • publications
  • courses
  • design

Blevmore Labs

Since 2018 I have been designing data visualizations and figures for grants, papers, and cover art submissions. I also enjoy creating lab websites and consulting on draft figures.

Please enjoy the example projects below and contact me at blevmorelabs at gmail dot com if you would like to work together!
​
Data Visualization
Illustration
Websites
 

Data Visualization


The below data visualization projects always start with considering both the data and the user. Each of the below projects were designed to be used with one's own data, and to be part of a researcher's workflow. For this reason, the visuals are often relatively simple, but still designed to offer insight into the data and mathematical concepts. To incorporate these visualizations into your own workflow, please see my github for the code.

Click on the images or links below to visit the interactive versions!
Picture

Classification results


Interactive plot!
Investigate how results of a classification analysis change based on altering a threshold parameter. Part of a recent paper.
github

Topological data analysis


Interactive plot!
Illustrates the face relations between simplices within a weighted simplicial complex.
Part of an upcoming visualization package.
Picture
Picture

Temporal networks


Interactive plot!
Visualizes a time-evolving network. Created as part of a presentation for the Network Neuroscience workshop at OHBM 2020.
github

Multilayer networks


Interactive plot!
Shows a multilayer network and supra-adjacency matrix. Created for the Network Neuroscience workshop at OHBM 2020. 
github
Picture
Picture

Simplicial complexes


Interactive plot!
Displays a simplicial complex and allows for visual investigation of the structure.
​
Part of an upcoming visualization package.


Scientific Illustration


Abstract concepts in science and mathematics offer a real visualization challenge. However, this is specifically my favorite challenge, as I enjoy creating inviting visuals that convey complicated ideas. Many of the graphics below were created with a specific audience in mind, from grant reviewers to new graduate students to biologists interested in mathematics. Click through the links below for more examples in each category.

Topological data analysis


Topology in Biology
The importance of the whole: Topological data analysis for the network neuroscientist
Picture
Picture

Complex systems


​System representations
​Dynamic graphs

Applications


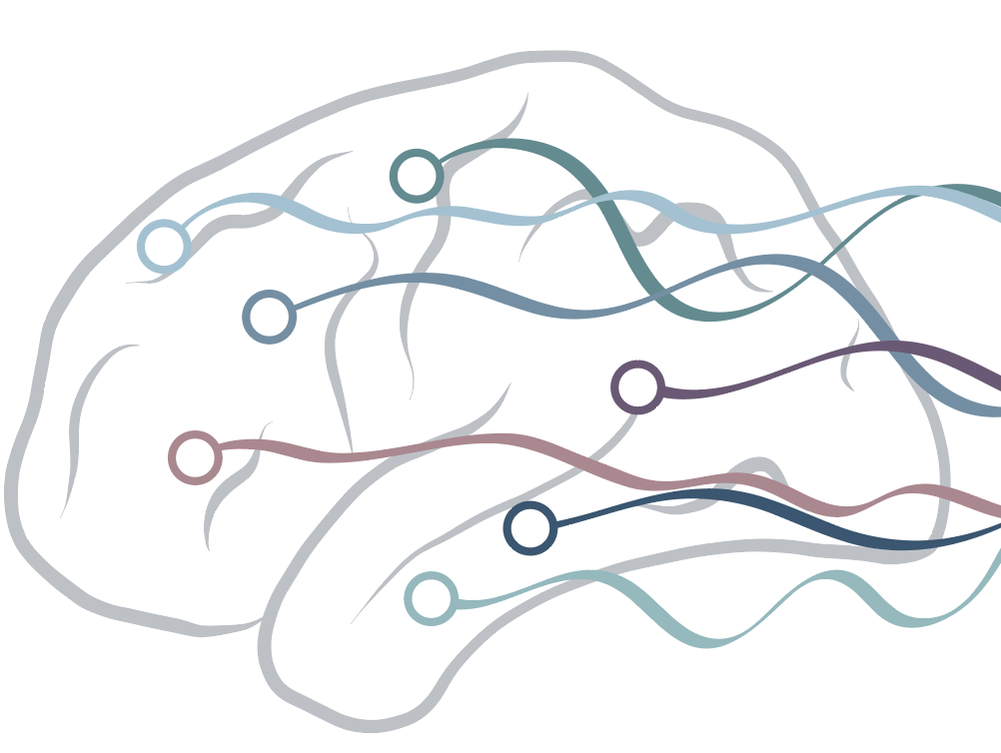
Models in neuroscience*
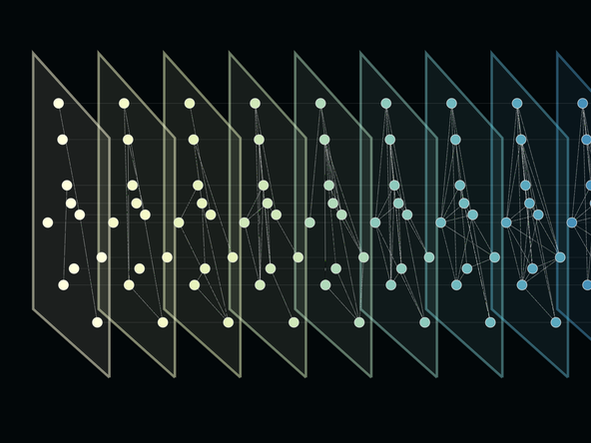
​Graph learning
Mechanical networks*
Diamond metalens*
Hexagonal boron nitride*
State initialization*​
Picture
* indicates commissioned work.
 

Website Design


A great lab website not only showcases work but also generates interest from new students and collaborators. I love working with creative individuals to design beautiful, functional, and personal websites.

Complex Systems Lab


https://complexsystemsupenn.com/
Picture
Picture

Perry Zurn Lab


https://www.perryzurn.com/

Center for Complex Biological Systems


https://www.ccbsupenn.com/
Picture
Picture

AHA! Lab


https://ahalabupenn.com/
all of the above websites represent commissioned work

Ann sizemore blevins

ann.e.sizemore@gmail.com
  • home
  • research
  • code
  • publications
  • courses
  • design